Measures of Variation
Range
Range is the easiest way to
identify the variation in the process, in simple terms range can be define as
the difference between the highest and lowest value in a set.
Example
|
Domino’s
|
6.5
|
6.6
|
6.7
|
6.8
|
6.8
|
6.9
|
7.0
|
7.1
|
7.2
|
7.3
|
|
Pizza Hut
|
4.2
|
5.4
|
5.8
|
6.2
|
6.7
|
7.2
|
7.2
|
8.5
|
9.3
|
10.0
|
Range for Domino’s pizza : 7.3 - 6.5 = 0.8
Range for Pizza Hut pizza : 10.0 - 4.2 = 5.8
The much
larger range in case of Pizza hut
pizza shows that their process has a larger variation than the Domino’s
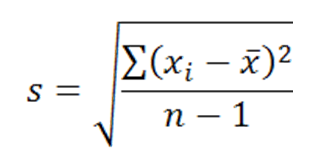
Standard deviation
Example
|
Domino’s
|
6.5
|
6.6
|
6.7
|
6.8
|
6.8
|
6.9
|
7.0
|
7.1
|
7.2
|
7.3
|
|
Pizza Hut
|
4.2
|
5.4
|
5.8
|
6.2
|
6.7
|
7.2
|
7.2
|
8.5
|
9.3
|
10.0
|
|
S.NO
|
Domino’s
|
x –
x̅
|
( x – x̅ )2
|
Pizza
Hut
|
x – x̅
|
( x – x̅ )2
|
|
1
|
6.5
|
-0.39
|
0.1521
|
4.2
|
-2.85
|
8.1225
|
|
2
|
6.6
|
-0.29
|
0.0841
|
5.4
|
-1.65
|
2.7225
|
|
3
|
6.7
|
-0.19
|
0.0361
|
5.8
|
-1.25
|
1.5625
|
|
4
|
6.8
|
-0.09
|
0.0081
|
6.2
|
-0.85
|
0.7225
|
|
5
|
6.8
|
-0.09
|
0.0081
|
6.7
|
-0.35
|
0.1225
|
|
6
|
6.9
|
0.01
|
0.0001
|
7.2
|
0.15
|
0.0225
|
|
7
|
7.0
|
0.11
|
0.0121
|
7.2
|
0.15
|
0.0225
|
|
8
|
7.1
|
0.21
|
0.0441
|
8.5
|
1.45
|
2.1025
|
|
9
|
7.2
|
0.31
|
0.0961
|
9.3
|
2.25
|
5.6025
|
|
10
|
7.3
|
0.41
|
0.1681
|
10.0
|
2.95
|
8.7025
|
|
Total
|
68.9
|
|
0.609
|
70.5
|
|
29.165
|
X̅ =
68.9/10 = 6.89 (Domino’s)
X̅ =
70.5/10 = 7.05 (Pizza Hut)
n = 10

Standard deviation for Domino’s = 0.26
Standard deviation for Pizza Hut = 1.8
Domino’s Pizza (0.26 minutes)
is lower than the standard deviation of Pizza hut pizza (1.8 minutes), in other
words the variation in Domino’s pizza process is less than the variation in the
Pizza Hut Pizza.
No comments:
Post a Comment