Control Charts
Control chart is a graphical method, used to study the process changes over a period of time. Collected data are plotted in time order. It has a central line called central point/target line. UCL (Upper control limit) and LCL (Lower control limit) are the specified to verify the process status, whether the process in control or not. UCL & LCL can be determined from the data which we already collected (Historical data)

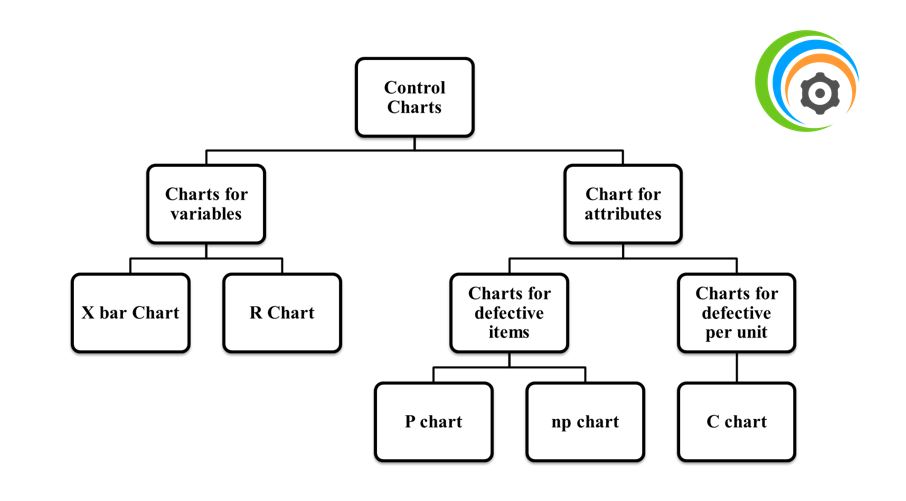
Charts for Variables
i. X bar Chart (Mean)
ii. R Chart (Range)
X bar chart:
A mean control chart is also known as X bar chart based on normal distribution. It is used to monitor the central tendency of a process. There are lower control limit (LCL) and upper control limit (UCL). If the data values lies in between both the limits it’s said to be in control or else out of control.
X bar control limits can be calculated from the formulae given below even if the standard deviation is unavailable.
R chart:
A range chart is also known as the mean chart. It is used to monitor the process dispersion. The concepts for use of range charts are similar to mean charts.
It can be calculated by the formulae given below.
Note:
If one or two observations are outside their control then the process is stopped to investigate the root cause. There are many factors contributing to the failure of process such as operator failure, machine failure etc. If no source is found, then simply the process should be restarted.

Charts for attributes
i. P-chart
ii. NP-chart
Above both are for number of defectives in a batch, the difference is P-chart is for defects in entire production and NP-chart is different batch size in production.
iii. C-chart
It is for number of defects per product.
iv. U-chart
P-chart:
It is used to monitor the proportion of defective items in a process. When observations can be placed into one of two categories either good or bad, pass or fail, operate or doesn’t operate.
The given below are formulae of P-chart:

NP-chart:
When data consist of multiple samples of n observations.
The following are formulae of np-chart:

C-chart
It is used when only number of occurrence per unit of measure can be counted. In this non occurrences cannot be counted. It includes
i. Scratches, chips, errors per item.
ii. Breaks, cracks, failures, complaints.

No comments:
Post a Comment